Abstract
Several thermoplastic staking technologies are available in the manufacturing industry. With many options to choose from, it is necessary to understand which processes are capable of achieving desired results. Hot air, ultrasonic, and InfraStake® were evaluated on cycle time, joint strength, strength repeatability, equipment cost, and operation cost to discern process capability. Each process has strengths and weaknesses, and recognizing each helps to determine which technology will produce the desired result in a specific application.
Introduction
There are many different technologies available for staking thermoplastic parts. How does a manufacturer choose which staking process is best for their unique needs? Is one staking technology better than the rest? If so, does it work well with all applications? This paper will address these questions.
Three plastic staking technologies, hot air, ultrasonic, and InfraStake or infrared (IR) staking, were investigated and compared. Each process was evaluated based on cycle time, strength of the stake it produced, repeatability of that strength, upfront equipment cost, and operation cost.
The Staking Process
Thermoplastic staking is a method of plastics joining that utilizes a molded boss or stud to mechanically retain another component. The boss, which protrudes through a hole in the other component, is heated to its glass transition temperature and formed into a stake which retains the two parts together. Various processes are used to accomplish this. While they differ in their application of heat and pressure, the basic concept is consistent across each.
Hot Air Process
The hot air staking process utilizes convection heat transfer. Compressed air is passed through a heater and directed at the plastic boss. Once the boss has been heated sufficiently, the hot air is switched off and a non-heated forming tool shapes the boss into a stake.
Ultrasonic Process
The ultrasonic staking process utilizes conduction heat transfer from friction. A metal tool called a horn or sonotrode vibrates at an ultrasonic frequency. The horn is brought into contact with the top of the boss and the vibration causes molecular friction in the plastic material. The frictional energy heats the plastic while the downward force of the horn acts as a forming tool and shapes the boss into a stake.
IR Staking Process
The IR staking process utilizes radiation heat transfer from focused IR energy. Reflective geometries inside the IR staking module direct and focus the energy radially around the boss. Once the boss has been heated sufficiently, a non-heated forming tool shapes the boss into a stake.
Experiments
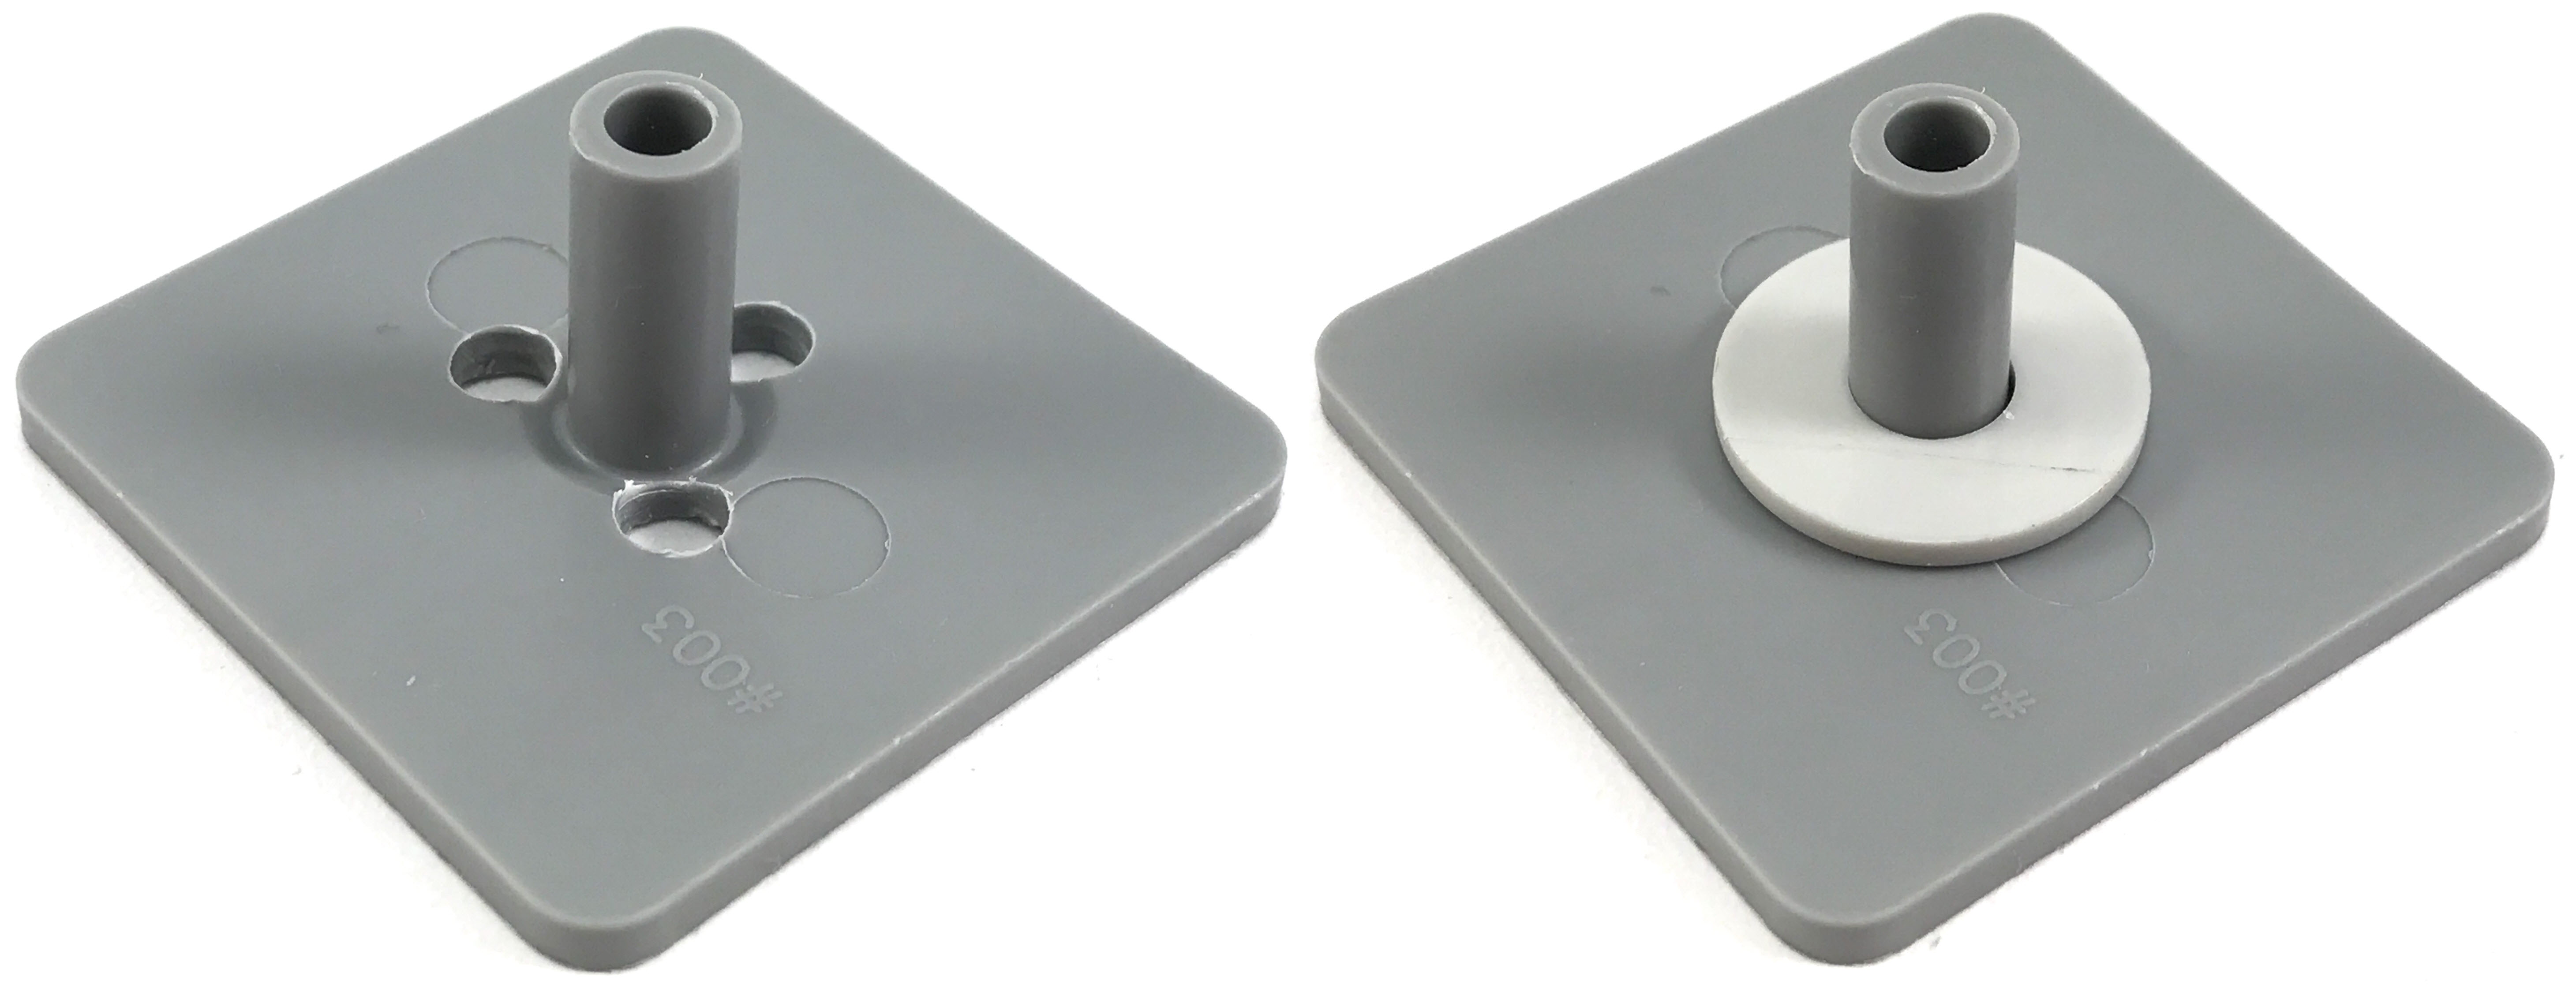
Testing was performed on several samples using each of the three staking methods [1]. Each sample consisted of a test plaque with one stake point or boss in the center. Two test plaque materials, polypropylene (PP) and polycarbonate (PC) were used with each process. The boss geometry on the test plaques was consistent across both materials (Table 1). Also, both materials were pigmented with the same light gray color. Nylon washers were placed over the bosses to simulate a mating component (Figure 1b).
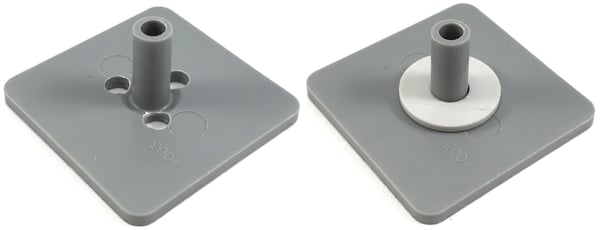 Figure 1. Test plaques, a) without washer, b) with washer
Nylon washers were used because they are incompatible with the test plaque materials that were tested and there was no risk of coincidental welding between the boss and the washer.
With each process, samples were staked with commonly shaped forming tools to create a consistent rosette-style stake geometry.
| Dimensions | Value |
| Boss Outer Diameter | 6.17 mm |
| Boss Inner Diameter | 3.91 mm |
| Washer Through-Hole | 6.73 mm |
| Boss Height Above Washer | 12.52 mm |
Hot Air Setup
The optimized hot air staking experimental setup involved air that was directed through a 400 W Farnam 0.5 inch outer diameter inline heater module [2]. The heated air flowed at a rate of 1 SCFM through two nozzles directed at opposite sides of the plastic boss. After a set heat time, the boss was heated sufficiently and the hot air was shut off. The forming tool was actuated downward over the boss, displacing it, and forming a stake. At the same time, 1 SCFM cooling air was directed around the forming tool, cooling both the tool and the stake. When the stake material was re-solidified, the forming tool retracted and the cooling air was shut off. The total cycle time for the hot air staking process was 22.0 s (Table 2 and Figure 2).
Ultrasonic Setup
The optimized ultrasonic staking experimental setup used a 40 kHz Dukane benchtop ultrasonic welder [3]. The ultrasonic horn made contact with the top of the boss and the vibratory ultrasonic energy heated and formed the boss into a stake. Once the horn reached a set position, the stake was fully formed and the ultrasonic energy was shut off. The horn continued to apply holding pressure as the stake cooled. After cooling, the horn retracted. The total cycle time for the ultrasonic staking process was 7.4 s (Table 2 and Figure 2).
IR Staking Setup
The optimized IR staking experimental setup used a model IS125 InfraStake module with a 100 W IR lamp. The InfraStake module clamped the sample components together. The IR lamp switched on and the energy from the lamp was focused on the boss using the internal reflective geometries of the module. After a set heat time, the boss was sufficiently heated and the IR lamp was shut off. Immediately, the internal forming tool was actuated downward over the boss to stake it. Meanwhile, 0.5 SCFM cooling air was passed through the module. Once the stake was re-solidified, the cooling air was shut off and the forming tool was retracted from the stake. Then the module retracted from the components. The total cycle time for the IR staking process was 15.0 s (Table 2 and Figure 2).
| Process Step | Hot Air | Ultrasonic | IR Staking |
| Pre-heat [s] | 3 | 0 | 0 |
| Press Down [s] | 0.5 | 0.8 | 0.5 |
| Heat [s] | 10 | 3.8 | 8 |
| Punch [s] | 8 | 2 | 6 |
| Press Up [s] | 0.5 | 0.8 | 0.5 |
| Total Cycle [s] | 22 | 7.4 | 15 |
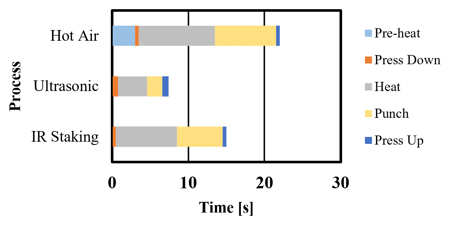 Figure 2. Cycle Times
Tensile Testing
Prior to staking, three evenly spaced holes were drilled around the boss into each test plaque (Figure 1a). This was to allow for tensile testing after staking. Staked samples were inverted and placed on top of tooling that supported the outer perimeter of the plaque while not touching the Nylon washer. A three prong tool with a load cell was used to push downward on the staked washer through the holes. When the stake failed, the maximum force applied to the sample was recorded. This process was repeated on each test plaque for all the processes and both materials. The tensile test results for each process were averaged and the repeatability of the results were calculated (Figure 3 and Figure 4).
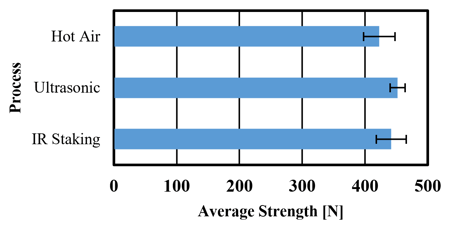
Figure 3. Average tensile test results and repeatability for PP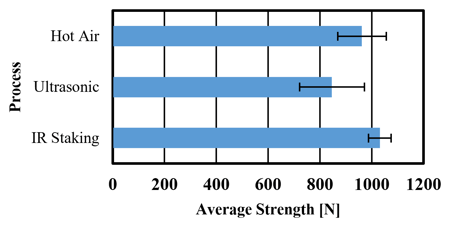 Figure 4. Average tensile test results and repeatability for PC
Cost Discussion
Equipment Cost
The cost of the equipment required to stake four door panels will vary significantly. Machines can be designed and built according to many different specifications, each of which may greatly affect the overall cost. In this study, each machine was assumed to be standalone and each would require manual loading by an operator. The total equipment cost was estimated assuming four machines with 65 stake points each (Figure 5) [4]. The machines for each process were assumed to have similar features to minimize their effect on cost.
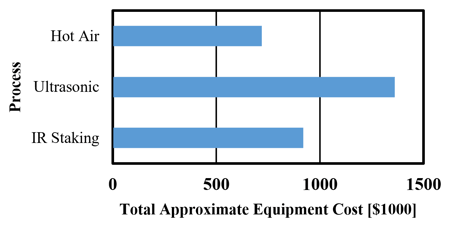 Figure 5. Estimated total equipment cost of each staking process for a door panel program
Operating Cost
Compressed air consumption and electricity usage were estimated to determine the approximate amount of energy required to operate each of the three staking technologies on a common, hypothetical, automotive door panel staking application. Some manufacturing assumptions were made and kept consistent for each staking technology to allow for comparison. It was assumed that the plant operates three eight-hour shifts per day, five days per week, and fifty weeks per year. This equates to 360,000 operating minutes annually. A machine takt time of 38 seconds was assumed meaning the equipment would cycle approximately 568,421 times each year.
To calculate the amount of compressed air that is consumed by each technology, the flow rate at each step of the process (Table 3) was multiplied by the amount of time to complete each step (Table 2), respectively. These values were summed together to find the total amount of air consumed per stake point per cycle. Multiplying the result by the number of cycles per year calculates the total air consumed per year, per stake (Figure 6).
| Process Step | Hot Air | Ultrasonic | IR Staking |
|---|---|---|---|
| Pre-heat [SCFM] | 1 | 0 | 0 |
| Press Down [SCFM] | 1 | 0 | 0 |
| Heat [SCFM] | 1 | 0 | 0.5 |
| Punch [SCFM] | 1 | 1 | 1 |
| Press Up [SCFM] | 1 | 1 | 1 |
| Average [SCFM] | 1 | 0.6 | 0.8 |
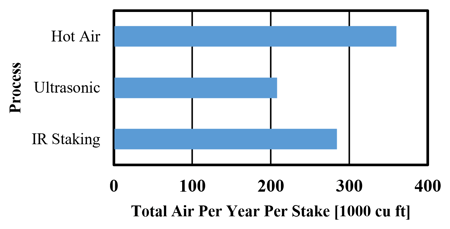 Figure 6. Total amount of air consumed with each staking process per stake point per year
To calculate the amount of electricity that is used by each process, it is necessary to understand the power draw of each heat source. Typically, hot air modules use a 400 W heater to heat the air [2]. The heater is powered on during the pre-heat, press-down, and heat stage of the cycle and powered off during the punch and press-up stage. In the ultrasonic staking process, approximately 85 W are used during the heat time. The energy is off during all of the other portions of the cycle. The IR staking process uses a 100 W lamp as the energy source. Like the ultrasonic process, the lamp is only on during the heat phase and off during all the other steps of the process. Using this information, the annual energy used per stake point was calculated by multiplying the annual operating time with the energy power draw and the ratio of on-time to total takt time.
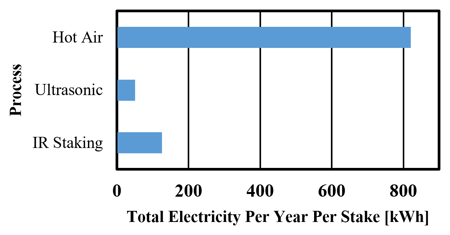 Figure 7. Total amount of electricity used with each staking process per stake point per year
In order to calculate the cost of compressed air consumption and electricity usage of each process, compressed air and electricity costs in a manufacturing plant must be known. These actual costs will differ between manufacturing plants. For this study, compressed air was estimated to cost $0.23 per 1000 cu ft [5] and electricity was estimated to cost $0.0726 per kWh [6]. For each process, the cost of each resource was multiplied by the estimated usage of that resource. The results for compressed air and electricity were summed to find the total annual cost of each staking process per stake point (Figure 8).
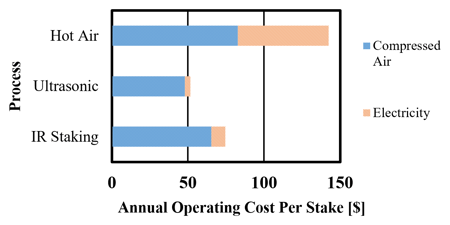 Figure 8. Total annual operating cost of each staking process per stake point
As an example, many automotive door panels average approximately 65 stake points per door panel and typically four doors per vehicle, for a total of 260 stake points in a complete door panel program. This stake quantity was multiplied by the annual cost per stake to find the total annual operating cost of each process for a door panel program.
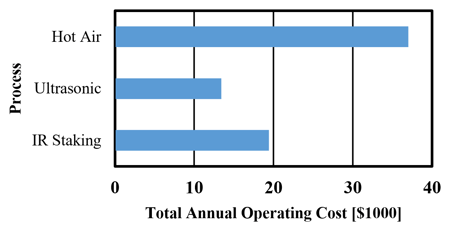 Figure 9. Total annual operating cost of each staking process for a door panel program
Discussion
The results of each area of the study were normalized to commonize their numerical scale. For some categories, a low value is more desired than a high value. For example, it is better to have a low operation cost than a high one. This is true for cycle time, repeatability (variation), operating cost, and equipment cost. The results in these categories were inverted so that a higher value represents a better rating. The results of all categories were then plotted in two radar charts for a visual representation of the overall performance of each process (Figure 10 and Figure 11) with each material.
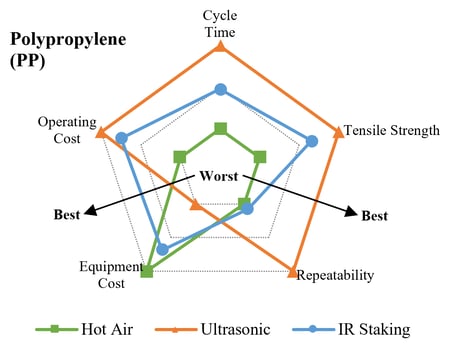
Figure 10. Overall, normalized staking process comparison with PP material
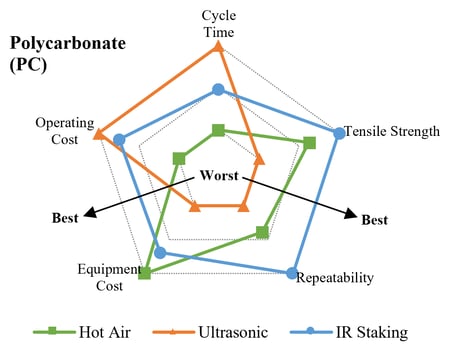 Figure 11. Overall, normalized staking process comparison with PC material
Hot Air
Of the three processes in this study, the hot air process took the most amount of time to stake the samples. The cycle time was nearly three times longer than the ultrasonic process. When staking PP, hot air produced the lowest strength joint with the most amount of variation. When staking PC, the strength and repeatability of the stakes were in the middle between those produced with ultrasonic and IR staking processes. The operating cost of hot air was clearly the highest, while the upfront equipment cost was the lowest.
Ultrasonic
The speed of the ultrasonic process was significantly faster than the other two processes; its cycle time was roughly half that of IR staking and one third that of hot air. Interestingly, ultrasonic delivered the highest strength and repeatability when staking PP, but the lowest strength and repeatability when staking PC. Counter to the hot air process, the operating costs of ultrasonic staking were the lowest, but the upfront equipment costs were the highest.
IR Staking
While the IR staking cycle time was longer than ultrasonic, it was nearly 50% faster than hot air. In stake strength with PP samples, it was only slightly lower than the strength produced by the ultrasonic process with repeatability that was slightly better than hot air. However, with the PC samples, IR staking had the highest strength and the best repeatability. The operating costs for IR staking were right in the middle, half the cost of hot air, but double the cost of ultrasonic. Finally, while the equipment costs were in the middle, they were only slightly higher than the costs of hot air equipment and significantly lower than ultrasonic.
Conclusions
Obviously, no single staking process was the best in every category. In many cases, the goals or requirements of an application may determine which staking process is the most suitable. For example, a staking application that requires low operating and equipment cost might mean that IR staking is the most suitable process. For another example, if the material to be staked is PP and a fast cycle time is desired, ultrasonic could be the best process for the application.
There are many different requirements for staking parts in various applications. When selecting a process, it is best to determine what factors are most important and choose a process that excels in those areas. There are optimal scenarios for each thermoplastic staking process.
References
- Internal testing, Extol, Inc., (2015).
- Farnam Model No: HTM050-400-120-CB-NF (003)
- LaFlamme, Dukane Corporation, ultrasonic testing data, (2015).
- Internal cost estimation, Extol, Inc., (2016).
- Lightner, Office of Industrial Technologies, Determine the Cost of Compressed Air for Your Plant, (2000).
- S. Energy Information Administration, Form EIA-826, Monthly Electric Sales and Revenue Report with State Distributions Report, (2016).